Places in the World: Treasures from the Venable Collection
The Americas: The Unexpected Continents
Although Europeans had known that the world was round since antiquity, the existence of the Americas was a surprise. When he set sail in 1492, Christopher Columbus had heavily underestimated the distance between Asia and Europe, reducing an 18,000-kilometer distance to 5,300 kilometers. Luckily for the Spanish explorers, there was a massive landmass only 7,000 kilometers to the west. As Europeans explored the new landmass, evidence mounted that this was not part of Asia but a different continent and in 1501, the Italian navigator Amerigo Vespucci (1454-1512) suggested that the area be called the “New World.” The German cartographer Martin Waldseemuller (ca. 1470-1520) subsequently named the new continent in Vespucci’s honor, using the feminine version of his Latinized name “Americus.” (All continents were considered feminine in Latin.) This name was then popularized by Gerhard Mercator (1512-1594) in a world map he prepared in 1538. A formal division into the two continents of North and South America did not fully take hold until the twentieth century.
The Americas collectively make up over a quarter of the planet’s landmass (nearly a third if one discounts the uninhabitable continent of Antarctica). For Europeans, they were truly a new world: European geography was based on classical and Islamic scholarship, none of which anticipated the presence of a continent between Asia and Europe. The only documents describing anything related to the Americas were the Vinland sagas and a few medieval histories of Northern Europe, none of which were heavily read in the south or provided much in the way of geographical detail. European maps of the western hemisphere were therefore heavily informed by guesswork and accounts by explorers more interested in treasure and territorial conquest than geographic information.
For this exhibit, we have chosen maps from the 1570s to the 1860s that highlight different aspects of mapping the western hemisphere: two maps depicting both American continents with approximately a hundred years of development between them, two maps from the 1780s depicting North and South America separately, and two maps of Missouri and the surrounding states from the 1860s. As you look at them, try to reflect on how they relate to one another. What information became available to cartographers between each map being made? What interests — political, economic, pedagogical, etc. — were coming to the forefront as the new maps were being drawn?
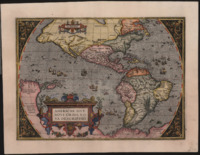
Americae sive novi orbis, nova descriptio.
Antwerp: Gilles Coppens de Diest, 1587.
Abraham Ortelius (1527-1598)
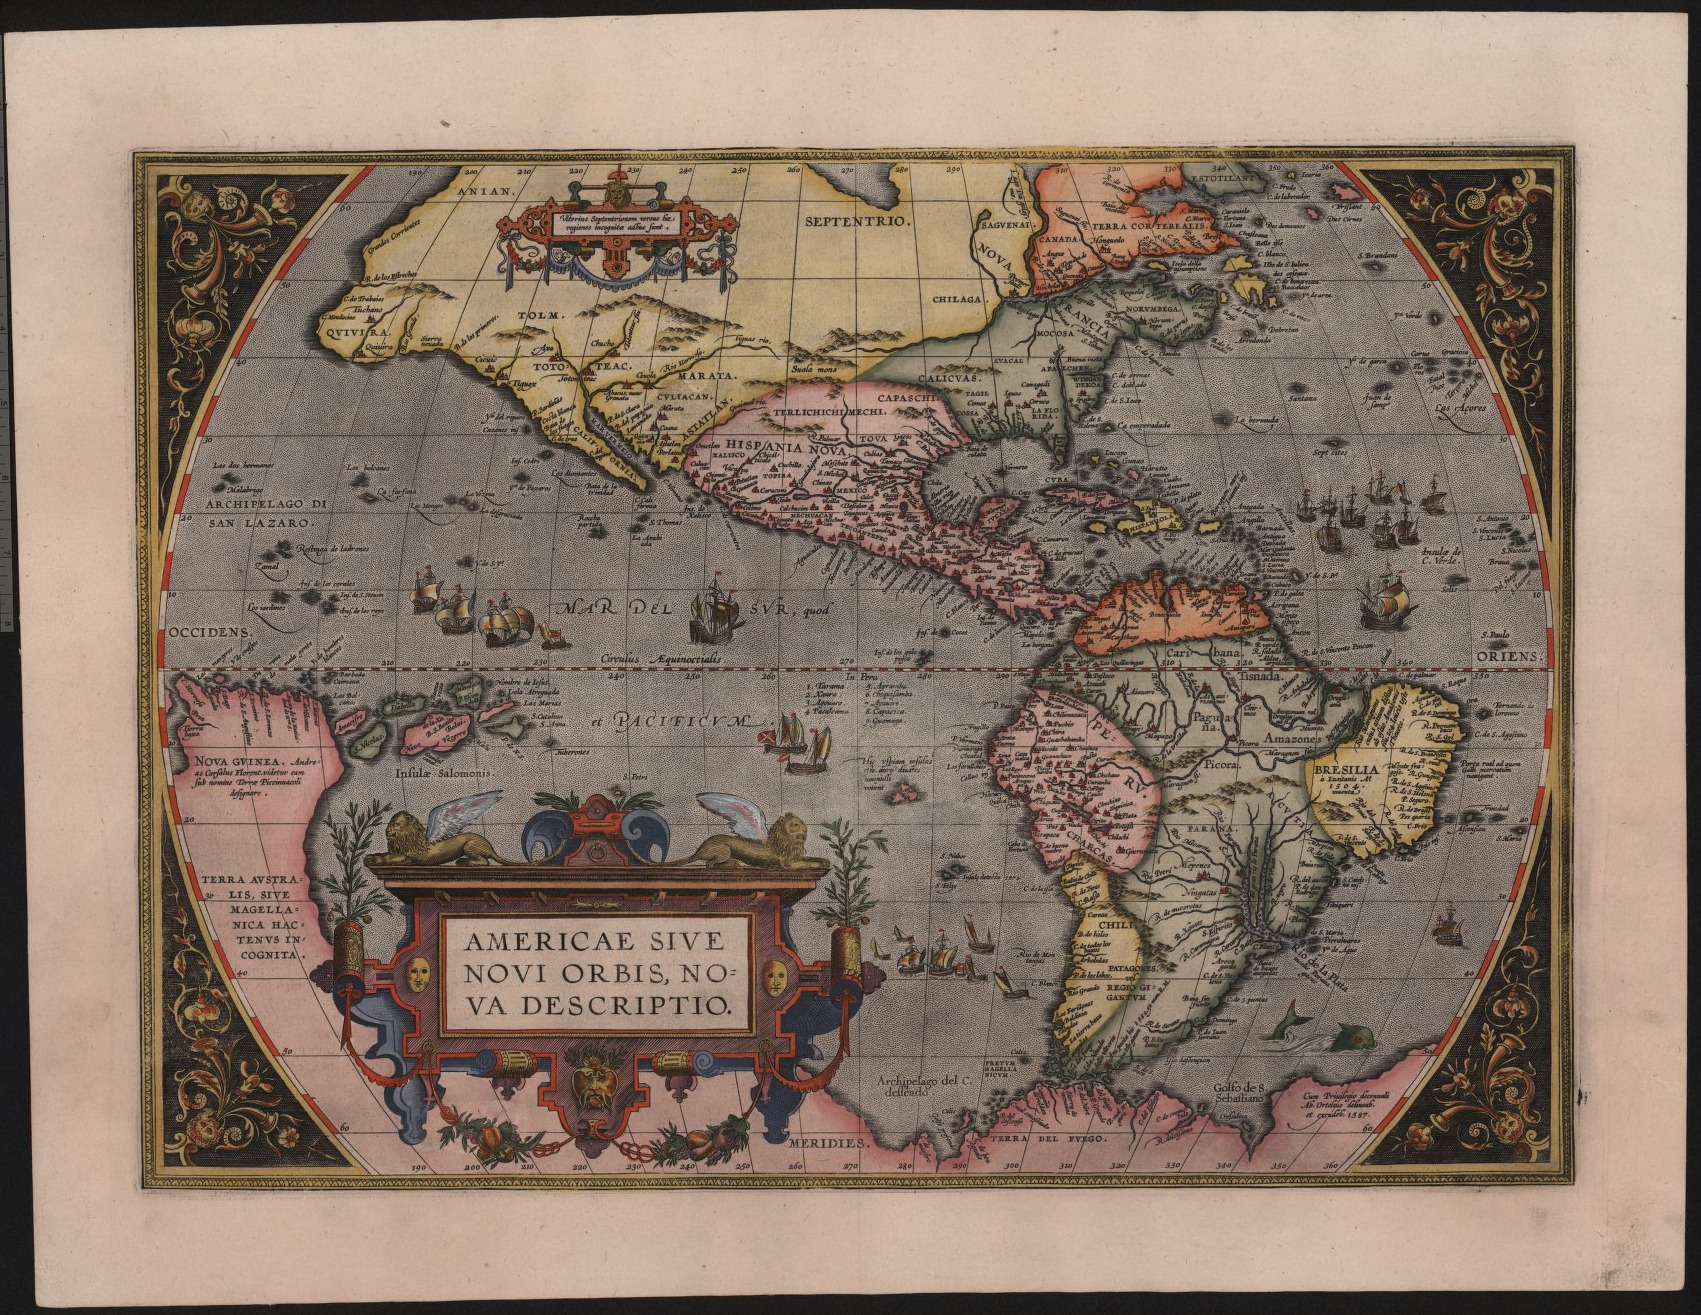
The Theatrum Orbis Terrarum (The theater of the lands of the world), first published in 1570, is the first world atlas, compiling and standardizing maps of the world from numerous sources. It also introduced a genre of atlas that was more than a collection of maps but rather included descriptive text alongside its maps. Versions of the atlas appeared in Latin, Dutch, German, French, Spanish, English, and Italian, spreading its influence far and wide across Europe. Americae sive novi orbis, nova descriptio (A new description of the Americas, or the new world) appeared in several different versions in the different editions of the atlas. The copy in Special Collections was part of a French-language edition and used the third plate, made in 1587, which corrected Chile’s bulge westward into the Pacific.
Like many of Ortelius’s maps, Americae sive novi orbis, nova decriptio was a flashpoint in the history of cartography, both as a summary of what had gone before and as a guide for future cartographers. Among other sources, Ortelius was drawing on his friend Gerhard Mercator’s 21-sheet world map (1569). The map shows North America extending too far to the west, a common error, but in Ortelius’s defense, this part of the continent had not been heavily explored by Europeans. He admits as much in a cartouche, noting that “Ulterius Septentrionem versus hae regiones incognitae adhunc sunt,” i.e., “these regions to the uttermost north are hitherto unknown.” Similarly, the theoretical continent Terra australis incognita appears at the bottom of the map. Ortelius’s map incorporates the Tierra del Fuego archipelago and New Guinea into the theorized continent. absorbing the Tierra del Fuego archipelago and New Guinea.
The engraver for Theatrum Orbis Terrarum was Franz Hogenberg (1535-1590), who worked in multiple European countries on a variety of projects. His skill is demonstrated by the minute notations throughout the map. Highlights include the cartouche already mentioned; an inscription off the coast of Brazil that indicates that French merchants sail to a port there; and an inscription near three islands of the coast of Peru. It reads: “Hic uspiam insulas esse, auro divites nonnulli volunt,” or, “Somewhere here there are islands, which people wish to be rich with gold.” The dubious tone would prove correct: there was not much gold to be found in the south Pacific.
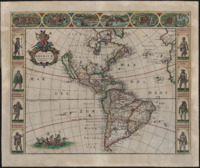
Nova Totius Americae Descriptio.
Amsterdam, 1666.
Frederik De Wit (1629-1706)
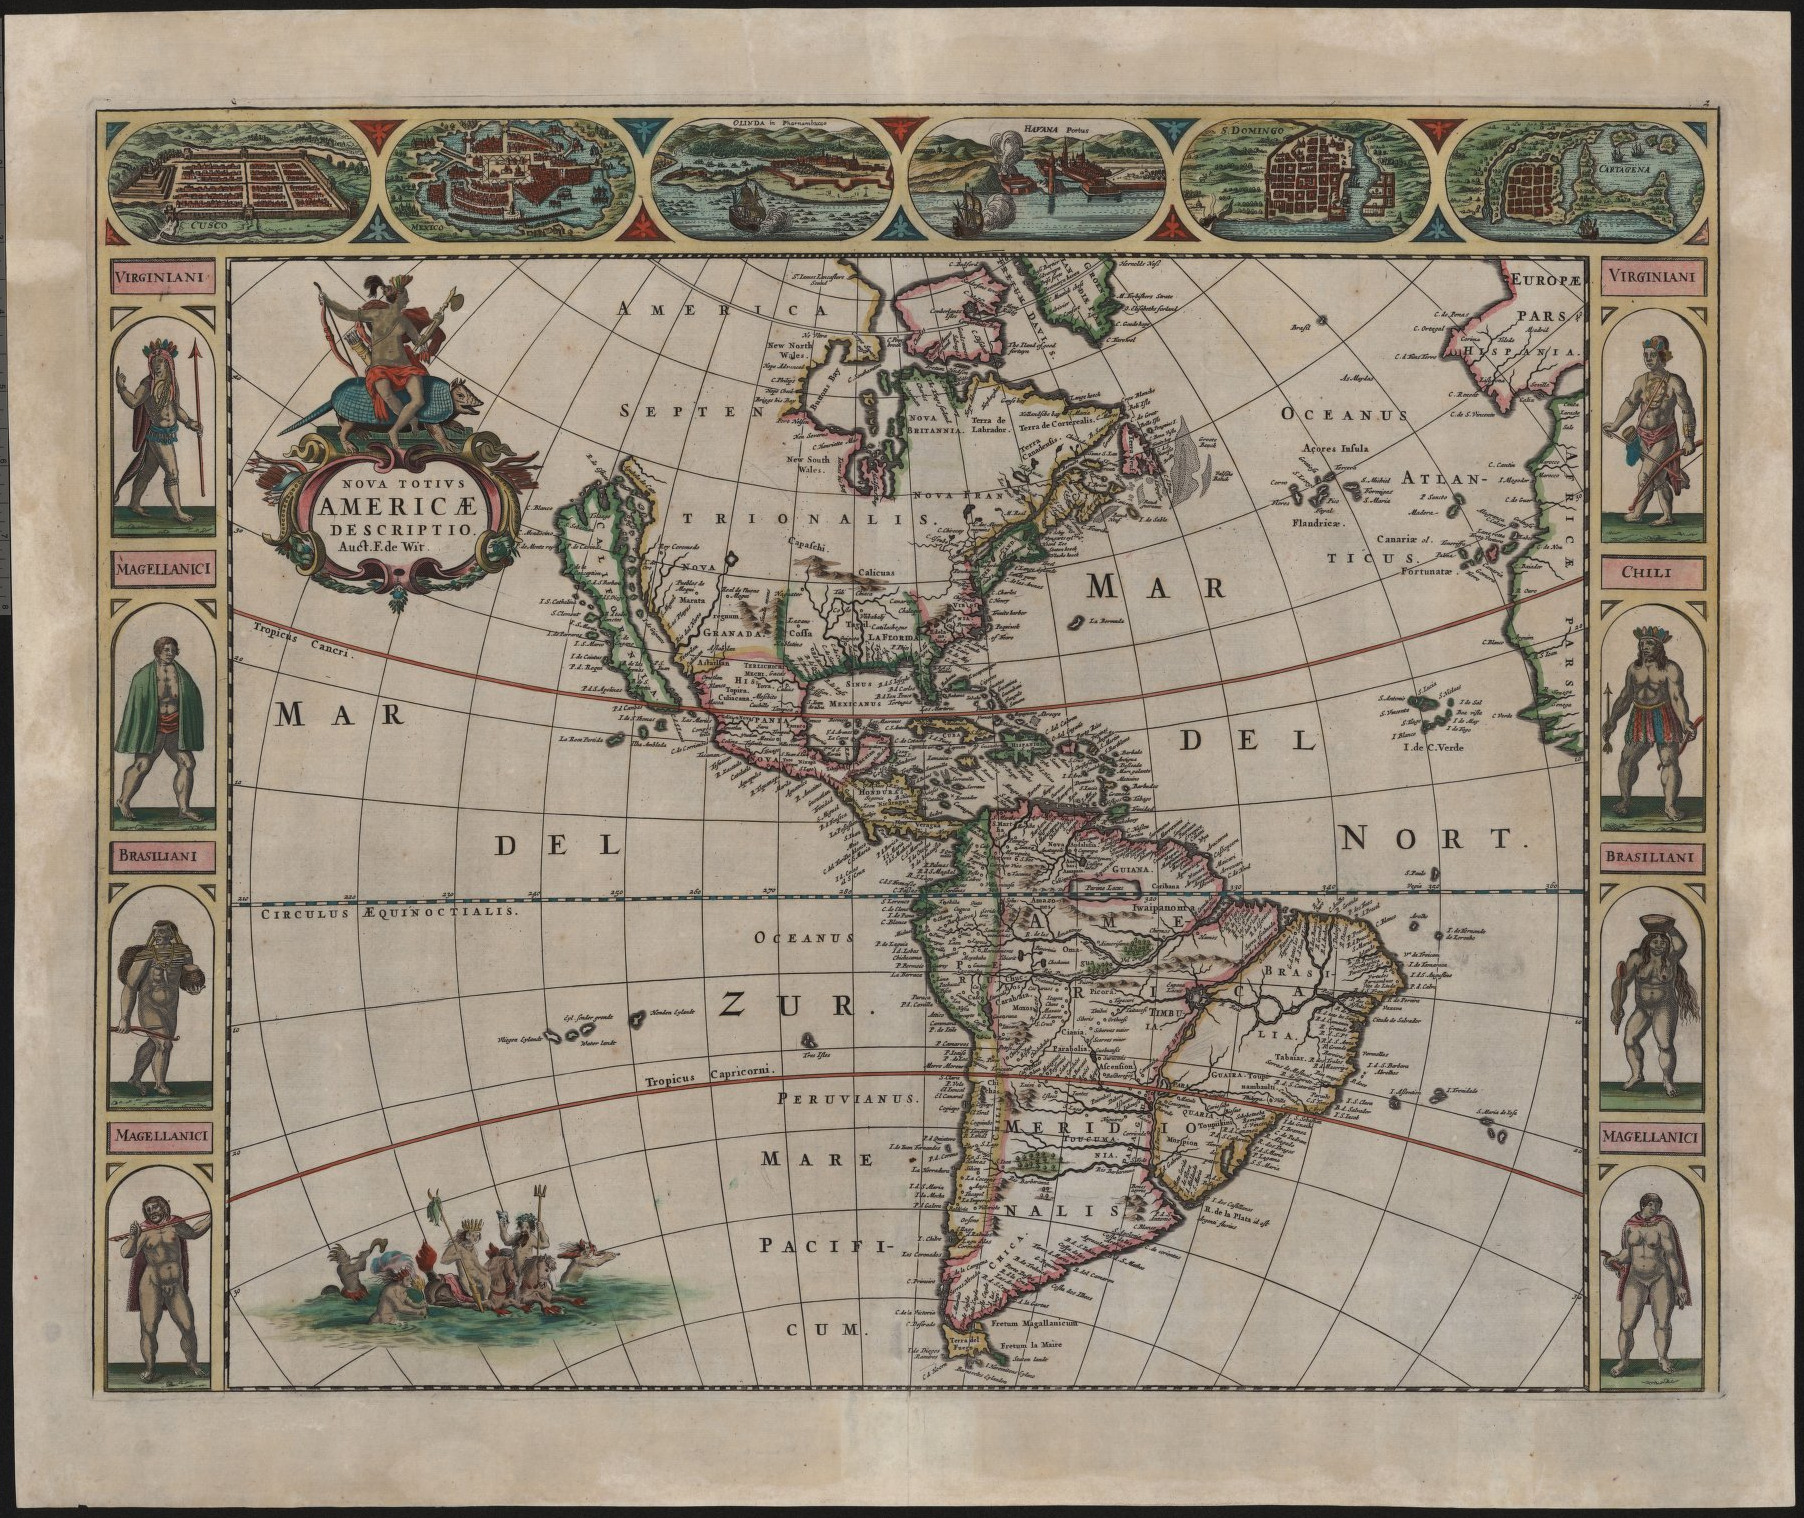
Frederik De Wit opted to print many of his atlases without text and with a limited number of maps, going against the encyclopedic tradition developed by Ortelius and Mercator. Instead of the comprehensive atlases printed by many of his competitors, which often came in multiple volumes and were correspondingly expensive, De Wit produced more concise atlases that could serve as an affordable, if less scholarly, alternative. Nova Totius Americae Descriptio (A new complete description of the Americas) was an early addition to De Wit’s mapmaking with some version of it appearing in his very earliest atlases.
In general, the map follows Dutch sources over those produced by other nations, which means that it is sometimes less accurate than contemporary maps by French cartographers. The region today referred to as “New England” is patriotically marked as Nieu Nederland (colored in green) but would be ceded to the British the following year in the Treaty of Breda. The farther west or north one goes, the less specific the details become, a reflection of the increasing lack of data. The northwestern coast of North America, trailing off where De Wit’s data ran out, but De Wit does include a beautiful instance of California as an island.
The map is generally more detailed for South America, where there are few completely blank regions. This is reflected with the cities chosen for display on top of the map: Cusco, Mexico City, Oldina, Havana, Santo Domingo, and Cartagena. All six cities are either in South America or the Caribbean. The cartes-à-figures are similarly focused on South America, depicting two “Virginians” (presumably intended to be Powhatan Algonquians) alongside a Chilean, two Brazilians, and three “Magellicans,” likely meaning Fuegians or southern Patagonians. The focus on South America likely stems from greater European colonial activity on the southern continent, which in turn would have provided more data for De Wit to draw his map.
A Map of South America With all the European Settlements & whatever else is remarkable from the latest & best observations.
[London, 1780].
Richard William Seale (1702-1762)
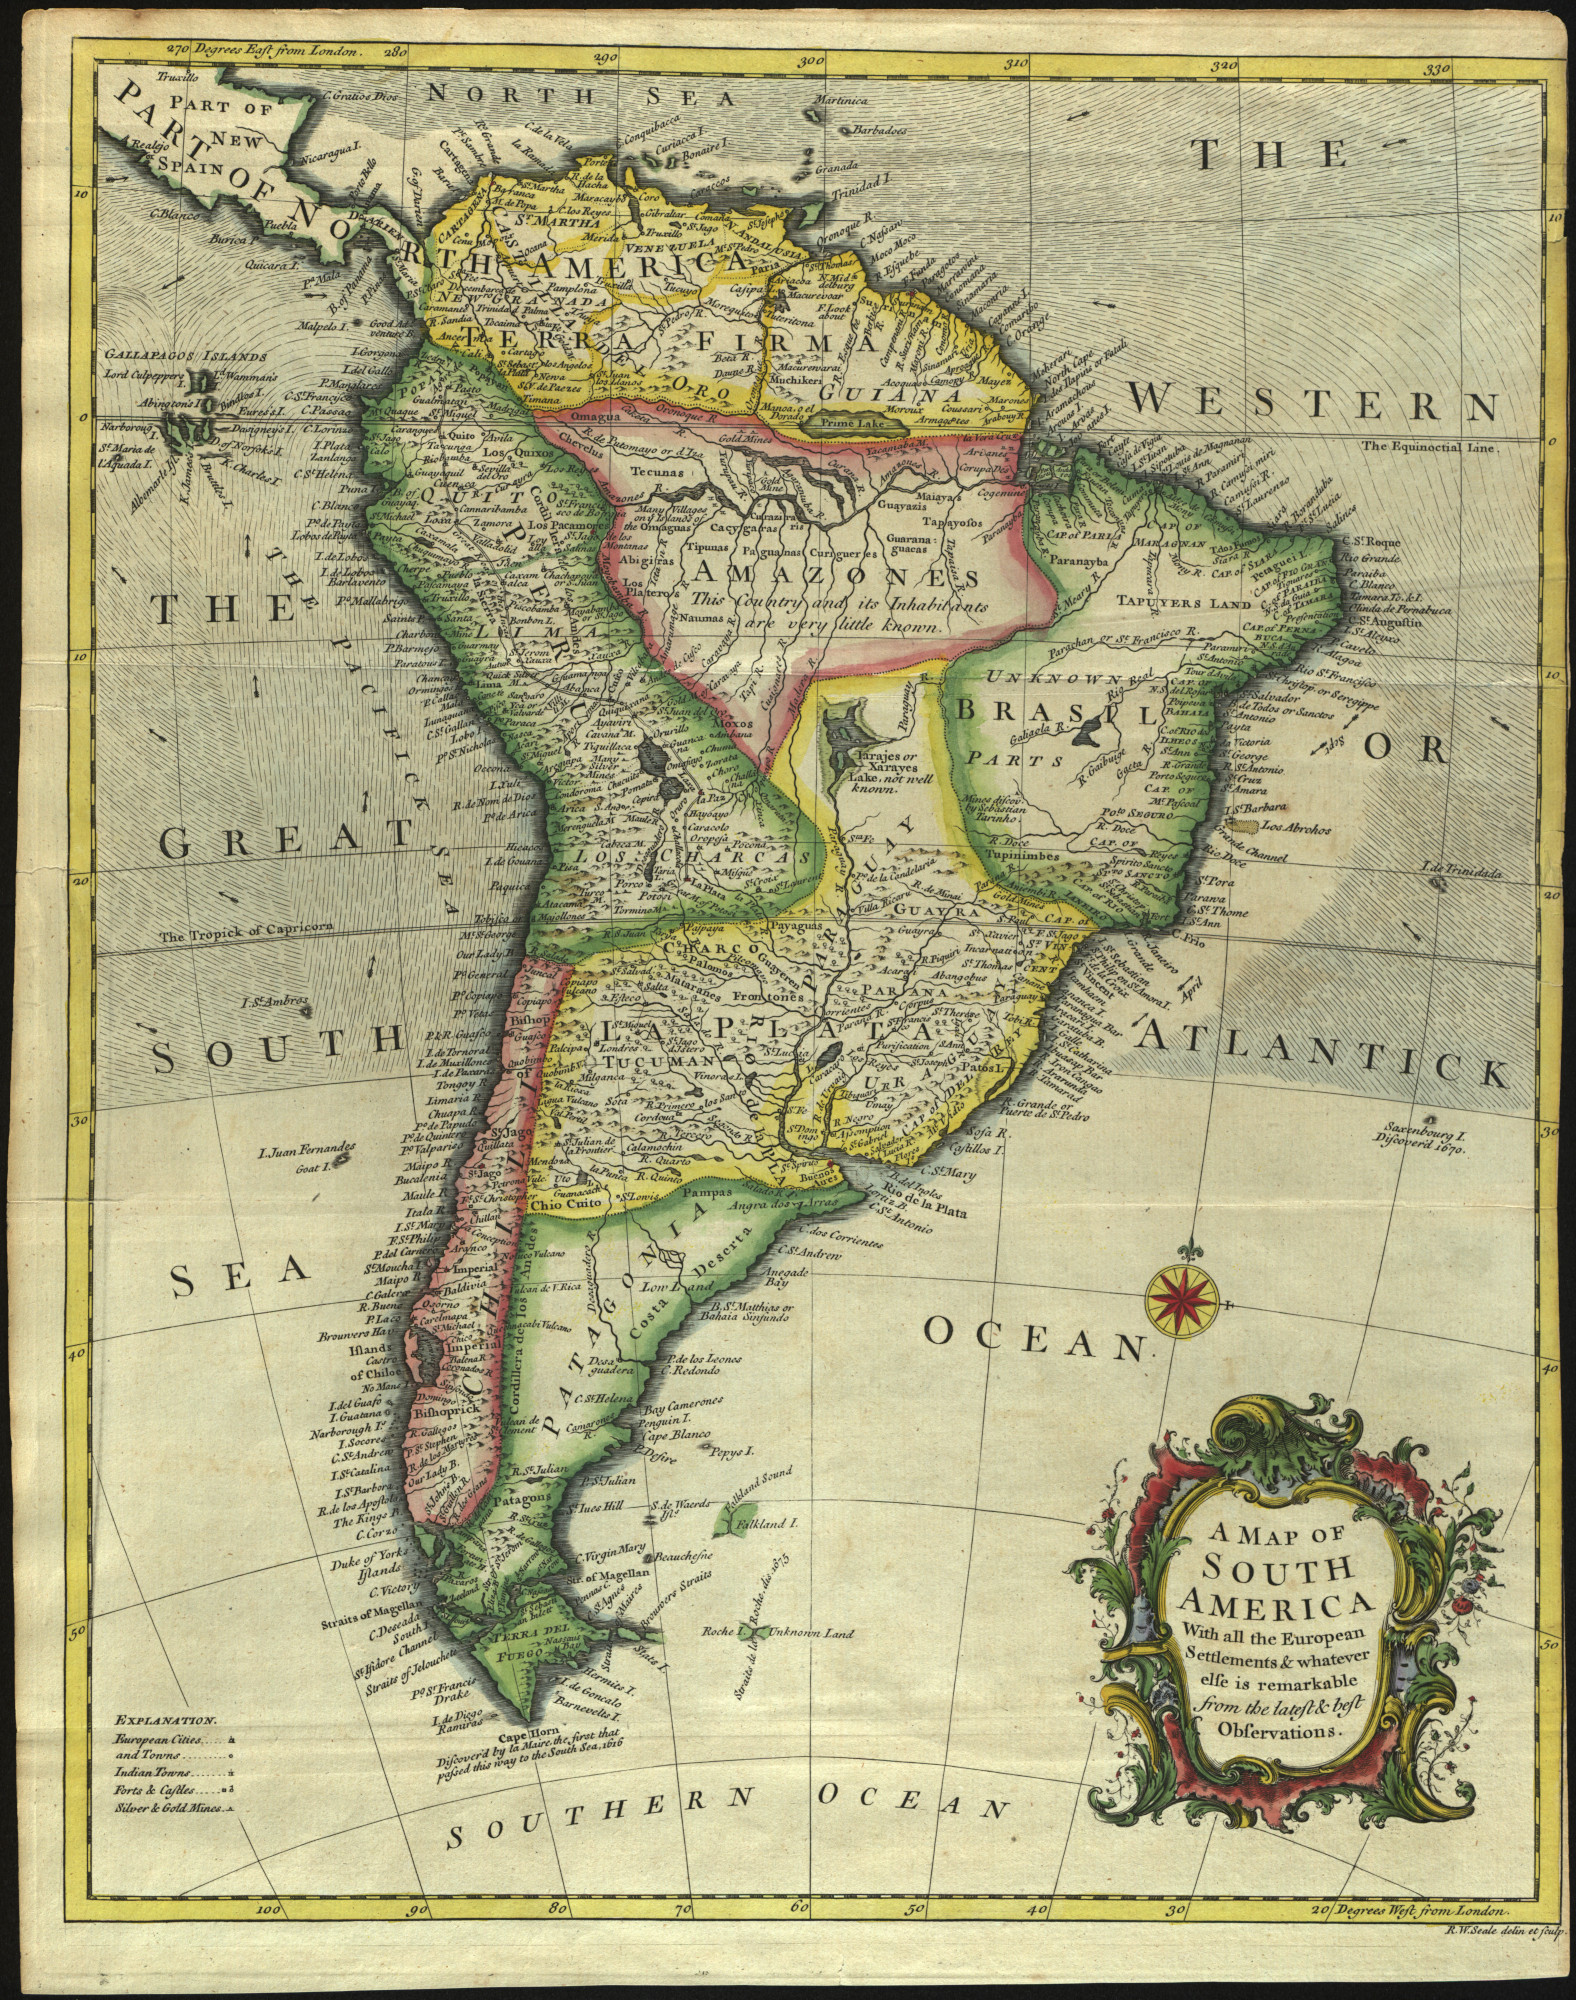
This map of South America, printed from an engraved plate and then beautifully hand-colored, is a wonderful example of the engraver’s art. It features a lot of fine detail, down to tiny but visually distinct differences between colonial settlements, native settlements, fortifications, and the all-important silver and gold mines that drew Europeans to the continent. Historical notes indicate the dates of navigational discoveries like Cape Horn. As with many maps from the eighteenth century, the map contains numerous fictional locations, including not one but two non-existent lakes: Prime Lake in the north and Xarayes Lake in the south. On the western shore of the Prime Lake is the city of El Dorado, neatly marked for the interested adventurer.
A recurring theme on the map is the admission of ignorance: “Amazones: This Country and its Inhabitants are very little known”; most of Brazil is labeled as “Unknown Parts”; and in northern La Plata we find the note “Iarajes or Xarayes Lake, not well known.” This kind of notation is at its funniest with Roche Island or, almost comically, “Roche I[sland] Unknown Land” where only the “Straits de la Roche” are noted but no information about the land surrounding them is provided. This last lack of clear information is perhaps not surprising, since no major landmass or island exists to the immediate east of Tierra del Fuego. A second phantom island on the map is Saxenbourg Island, noted on the map as having been discovered in 1670 though it has proven stubbornly ever elusive since.
The number of errors on this map may serve as a reminder of the challenges faced by mapmakers of the period. Even with centuries of surveying, maps of Europe were not always accurate either and at 17 million square kilometers, South America is considerably larger than Europe’s 10 million square kilometers. Seale and his collaborators were in London, half a world away and forced to rely on second-hand reports in order to satisfactorily map it. Seen from that perspective, the fact that the dimensions of the continent are largely correct seems almost miraculous.
A New Map of the British Empire in North America.
[London, ca. 1785].
Thomas Kitchin (1718-1784)
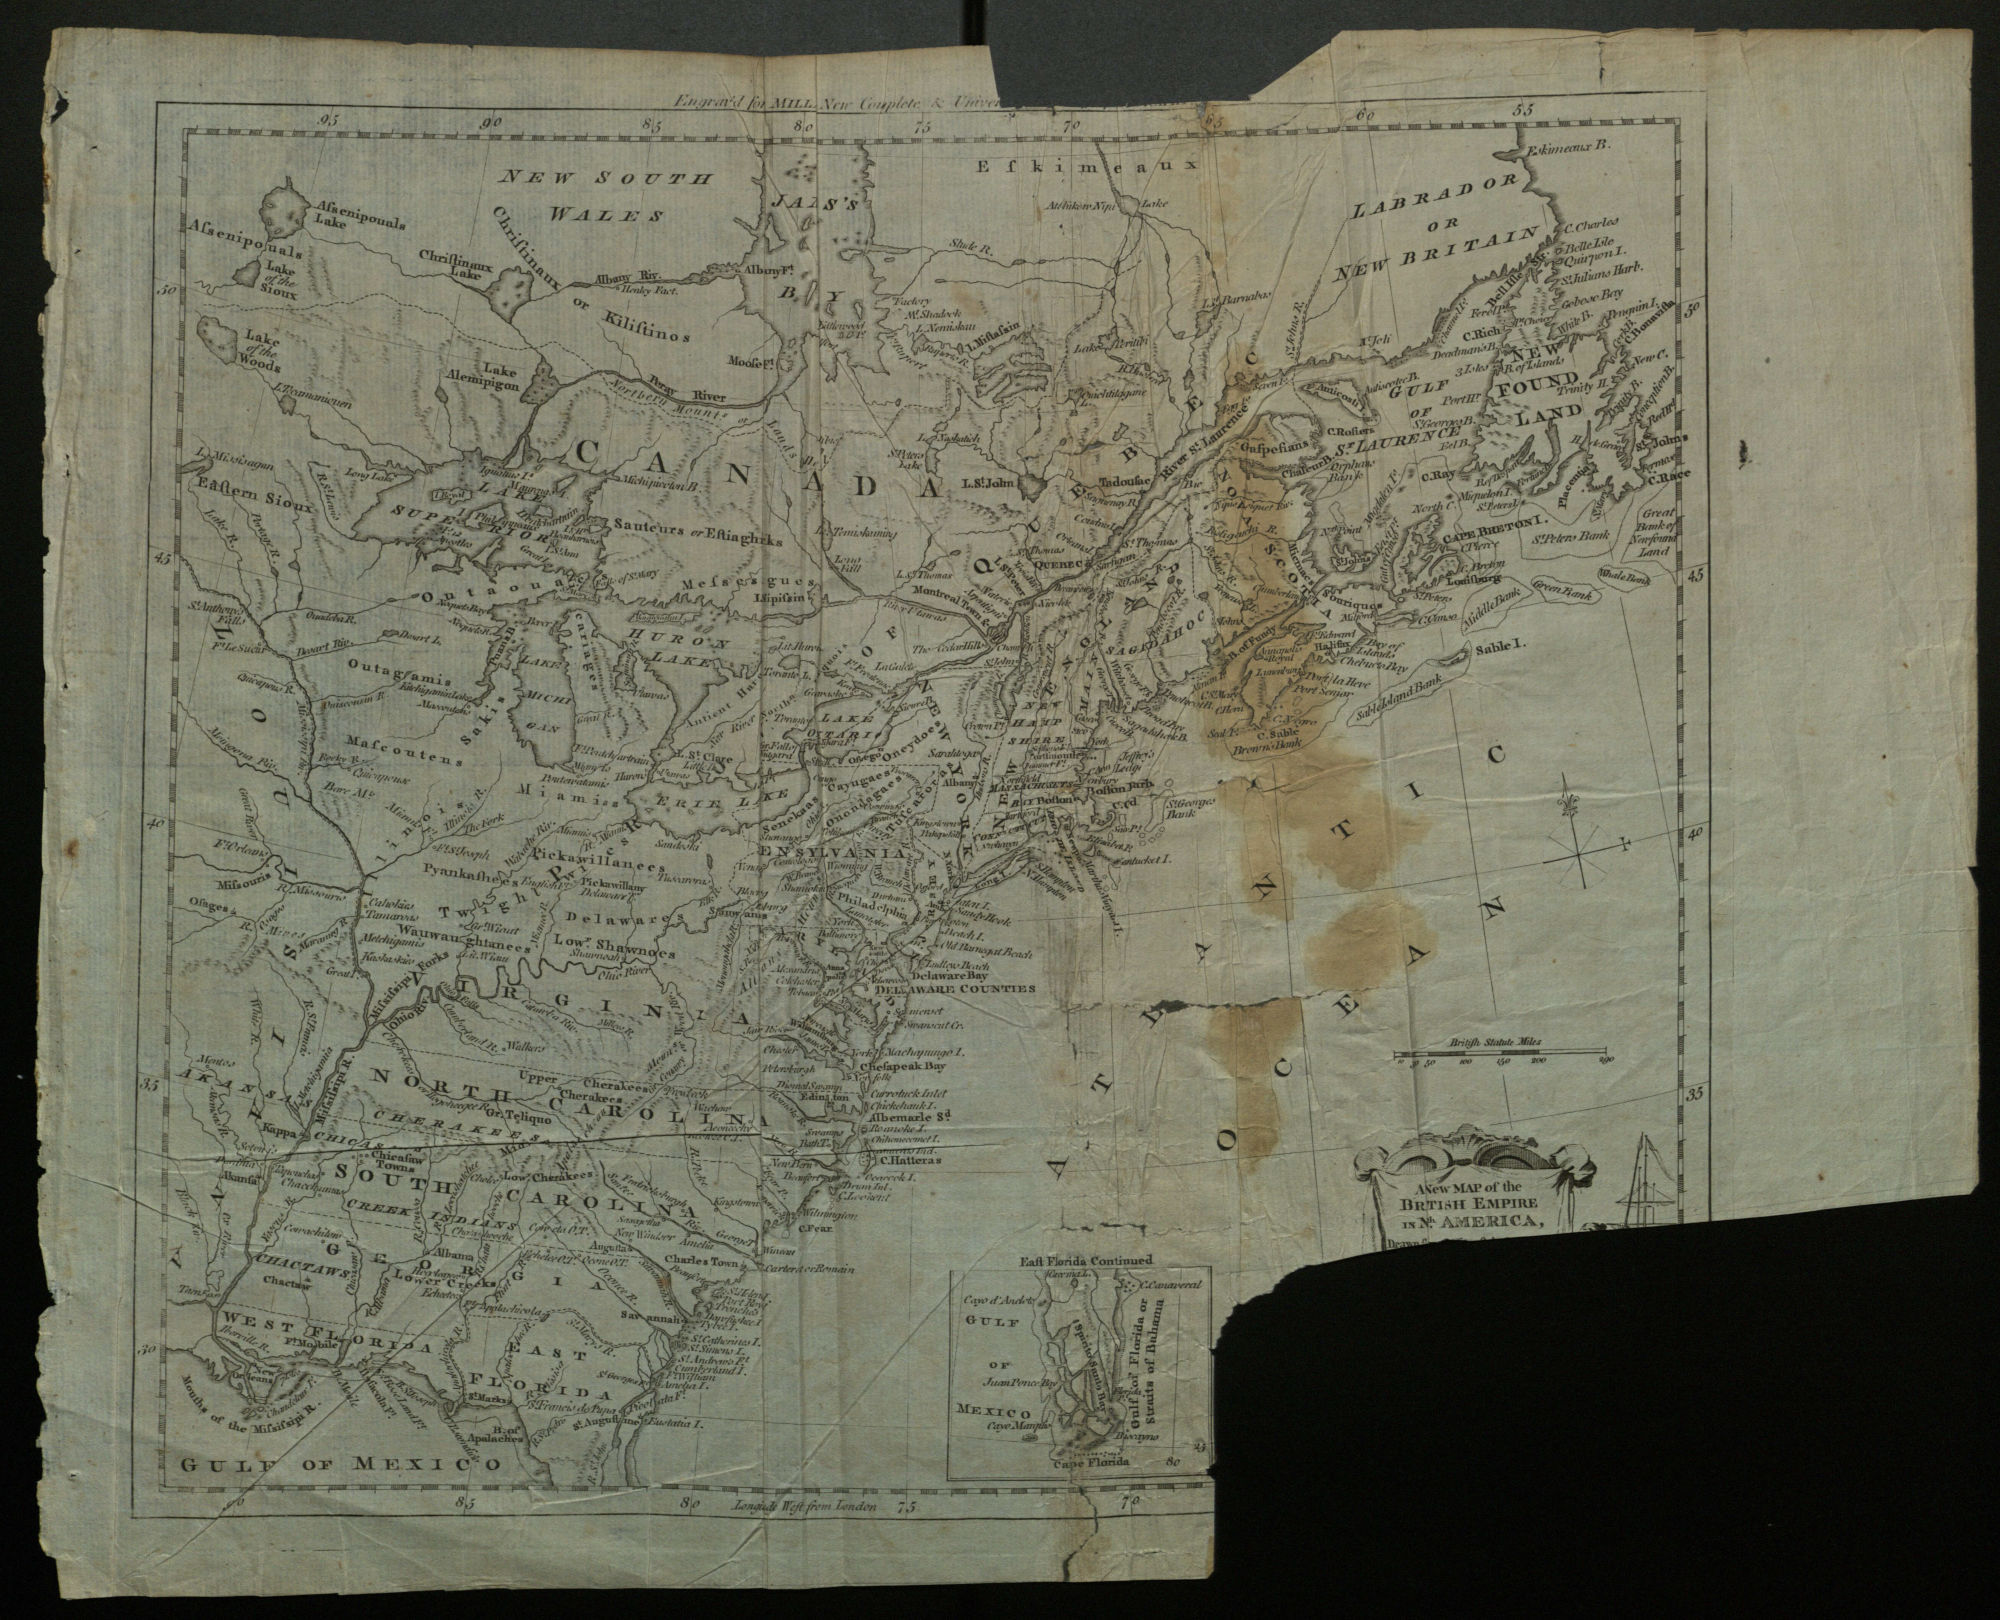
This map was included in Millar’s New Complete & Universal Geography, which first appeared in 1782 and went through a few editions until 1785. It includes the names of Native American villages and territories and, perhaps unexpectedly, labels them in much the same way as the settlements of the European colonists. The English provinces are distinguished from the other labels by being done in all capital letters.
The decorative cartouche in the lower right corner has largely been removed, possibly by a collector interested only in cartouches or engraving rather than maps. Its full text would have been “A New Map of the British Empire in N[or]th America, Drawn from the Latest Authorities by Tho[ma]s Kitchin Geo[graphe]r Hydrographer to his Majesty.” The full cartouche depicts a group of Native Americans making their obeisance to Britannia, who is seated before a European sailing ship. The masts of the ship and Britannia’s spear are still visible next to the title.
The extent of the map is overly optimistic, given that the American Revolution (fought between 1776 and 1783) led to the loss of lands south of the Great Lakes to the nascent United States of America. It represents the state of affairs after the end of the French and Indian War (1754–1763), at which point New France was ceded to the British. Florida, which is only partially visible on the map, was also absorbed by the British Empire at the time but the British did little to settle it and it would be returned to Spanish control at the conclusion of the American Revolution in 1783. The map focuses on those territories which the British saw as productive parts of their dominion in the Americas, even if British control over much of those territories was theoretical at best. In this regard, maps serve as a form of propaganda, intended to emphasize the power of Great Britain in controlling nearly half the North American continent.
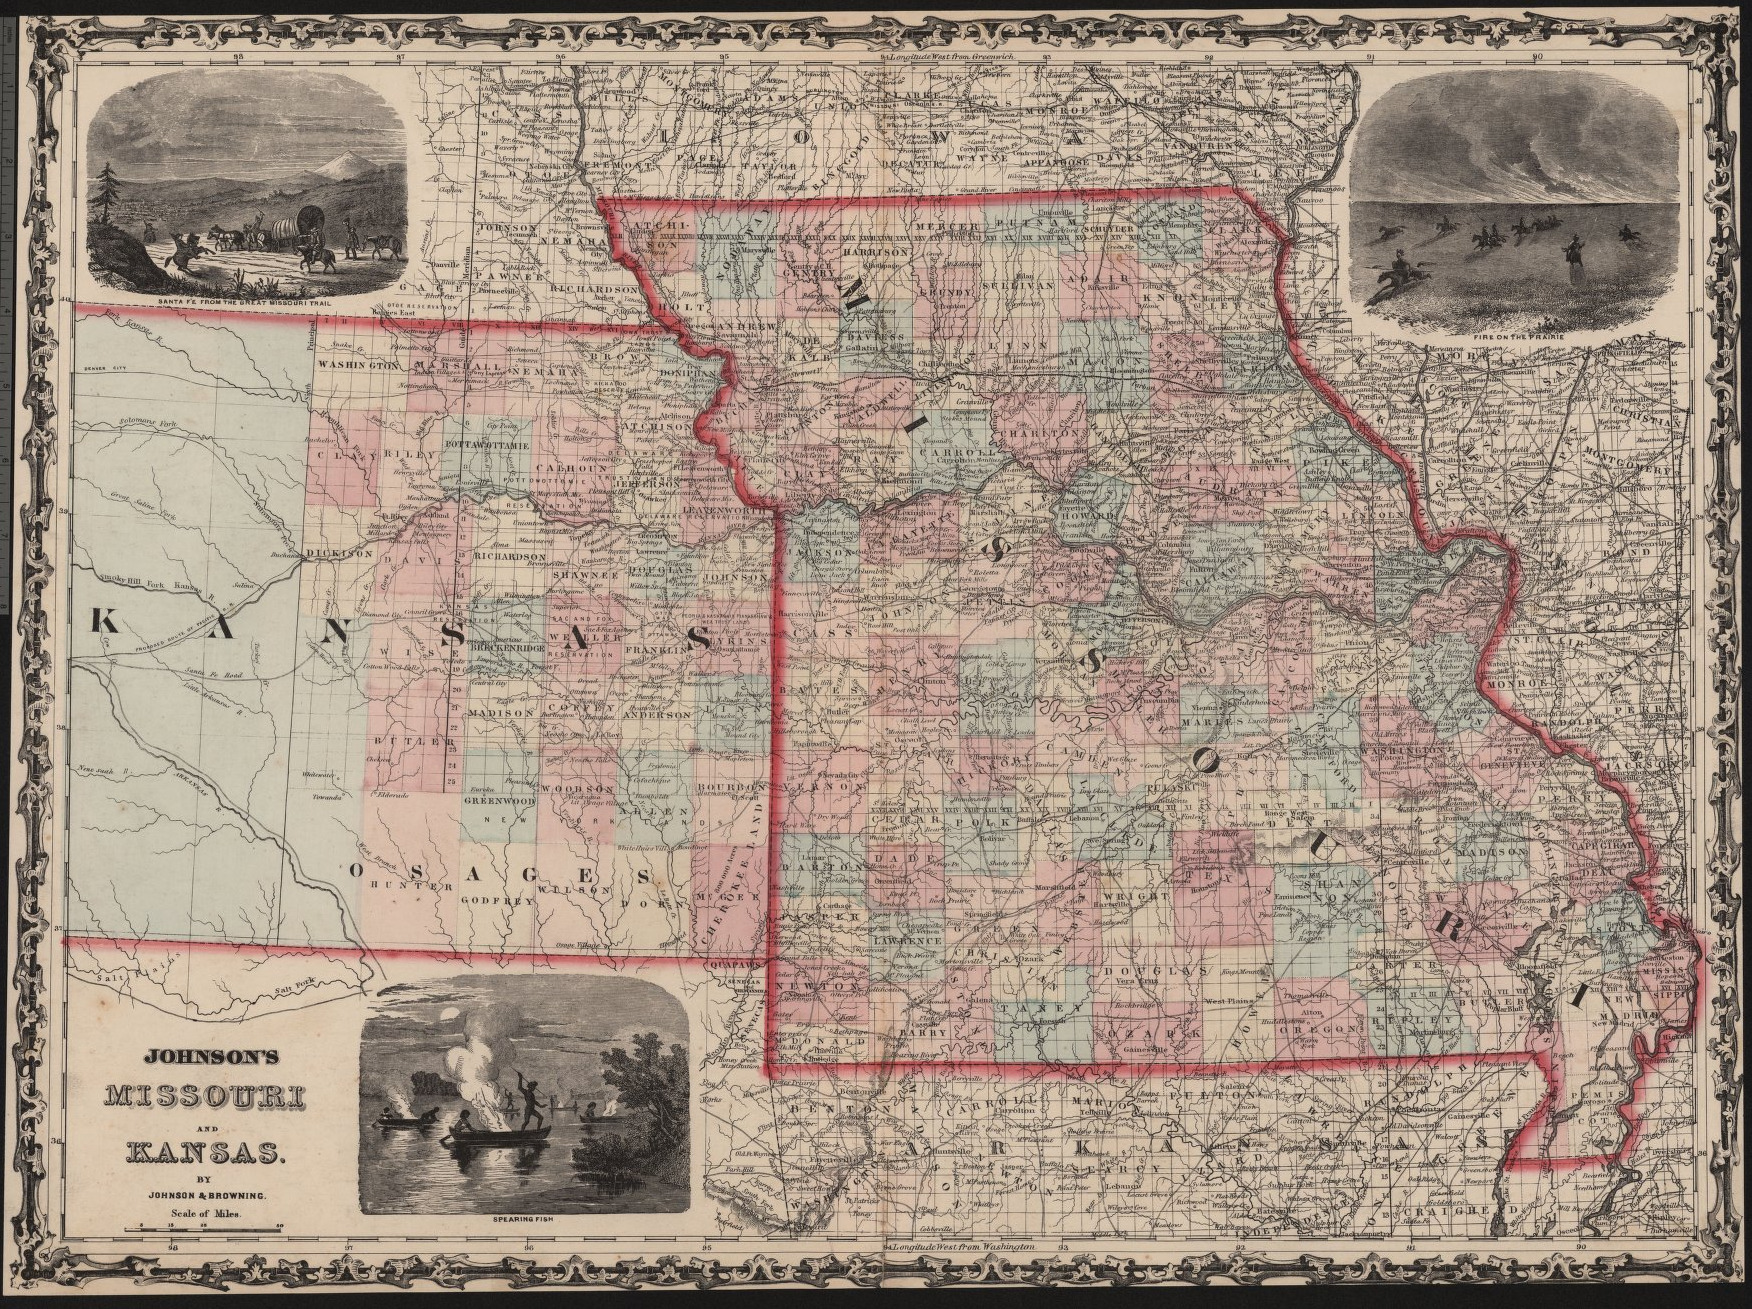
A.J. Johnson's Missouri and Kansas.
[New York City, ca. 1862].
Alvin J. Johnson (1827-1884)
Johnson’s Family Atlas first appeared in 1860 and was updated annually to take into account shifts in territorial and state boundaries. In addition to updating maps, new editions would also add and remove maps over time as well as changing the decorative border around a map or rearranging the illustrations. These changes can be used to date a map from Johnson’s atlases, especially if page numbers are present. The configuration of this map indicates quite strongly than it is from 1861 or 1862, most likely 1862.
Johnson’s map goes into greater detail in his map of Missouri than his competitor Samuel Augustus Mitchell. The map color-codes different states using red, green, and uncolored stencils to create a patchwork of counties that are easy to differentiate from one another. The map also includes (but does not fully label) railroads in addition to rivers and other geographical features. The result is a map jam-packed with information that highlights some of the major transportation hubs: St. Louis, for instance, sits at the center of a spiderweb of railroads, as do Springfield, Jefferson City, and Columbia (to name only a few).
The illustrations on this map hearken back to the older map traditions represented elsewhere in this exhibit. They depict moments of pioneer history: settlers approaching New Mexico on the Missouri Trail, a wildfire on the prairie, and Native Americans spearfishing by night. By 1862, none of these were likely to be common sights in Missouri, especially not as the Civil War intensified. Still, the images remain appropriate since by the 1860s, Missouri and Kansas were on the western edge of the contiguous United States, with California and Oregon isolated on the west coast and separated from the rest of the country. Kansas had only become a state in 1861 and so the inclusion of frontier imagery may be a reminder that much of America had not yet been fully incorporated into states.
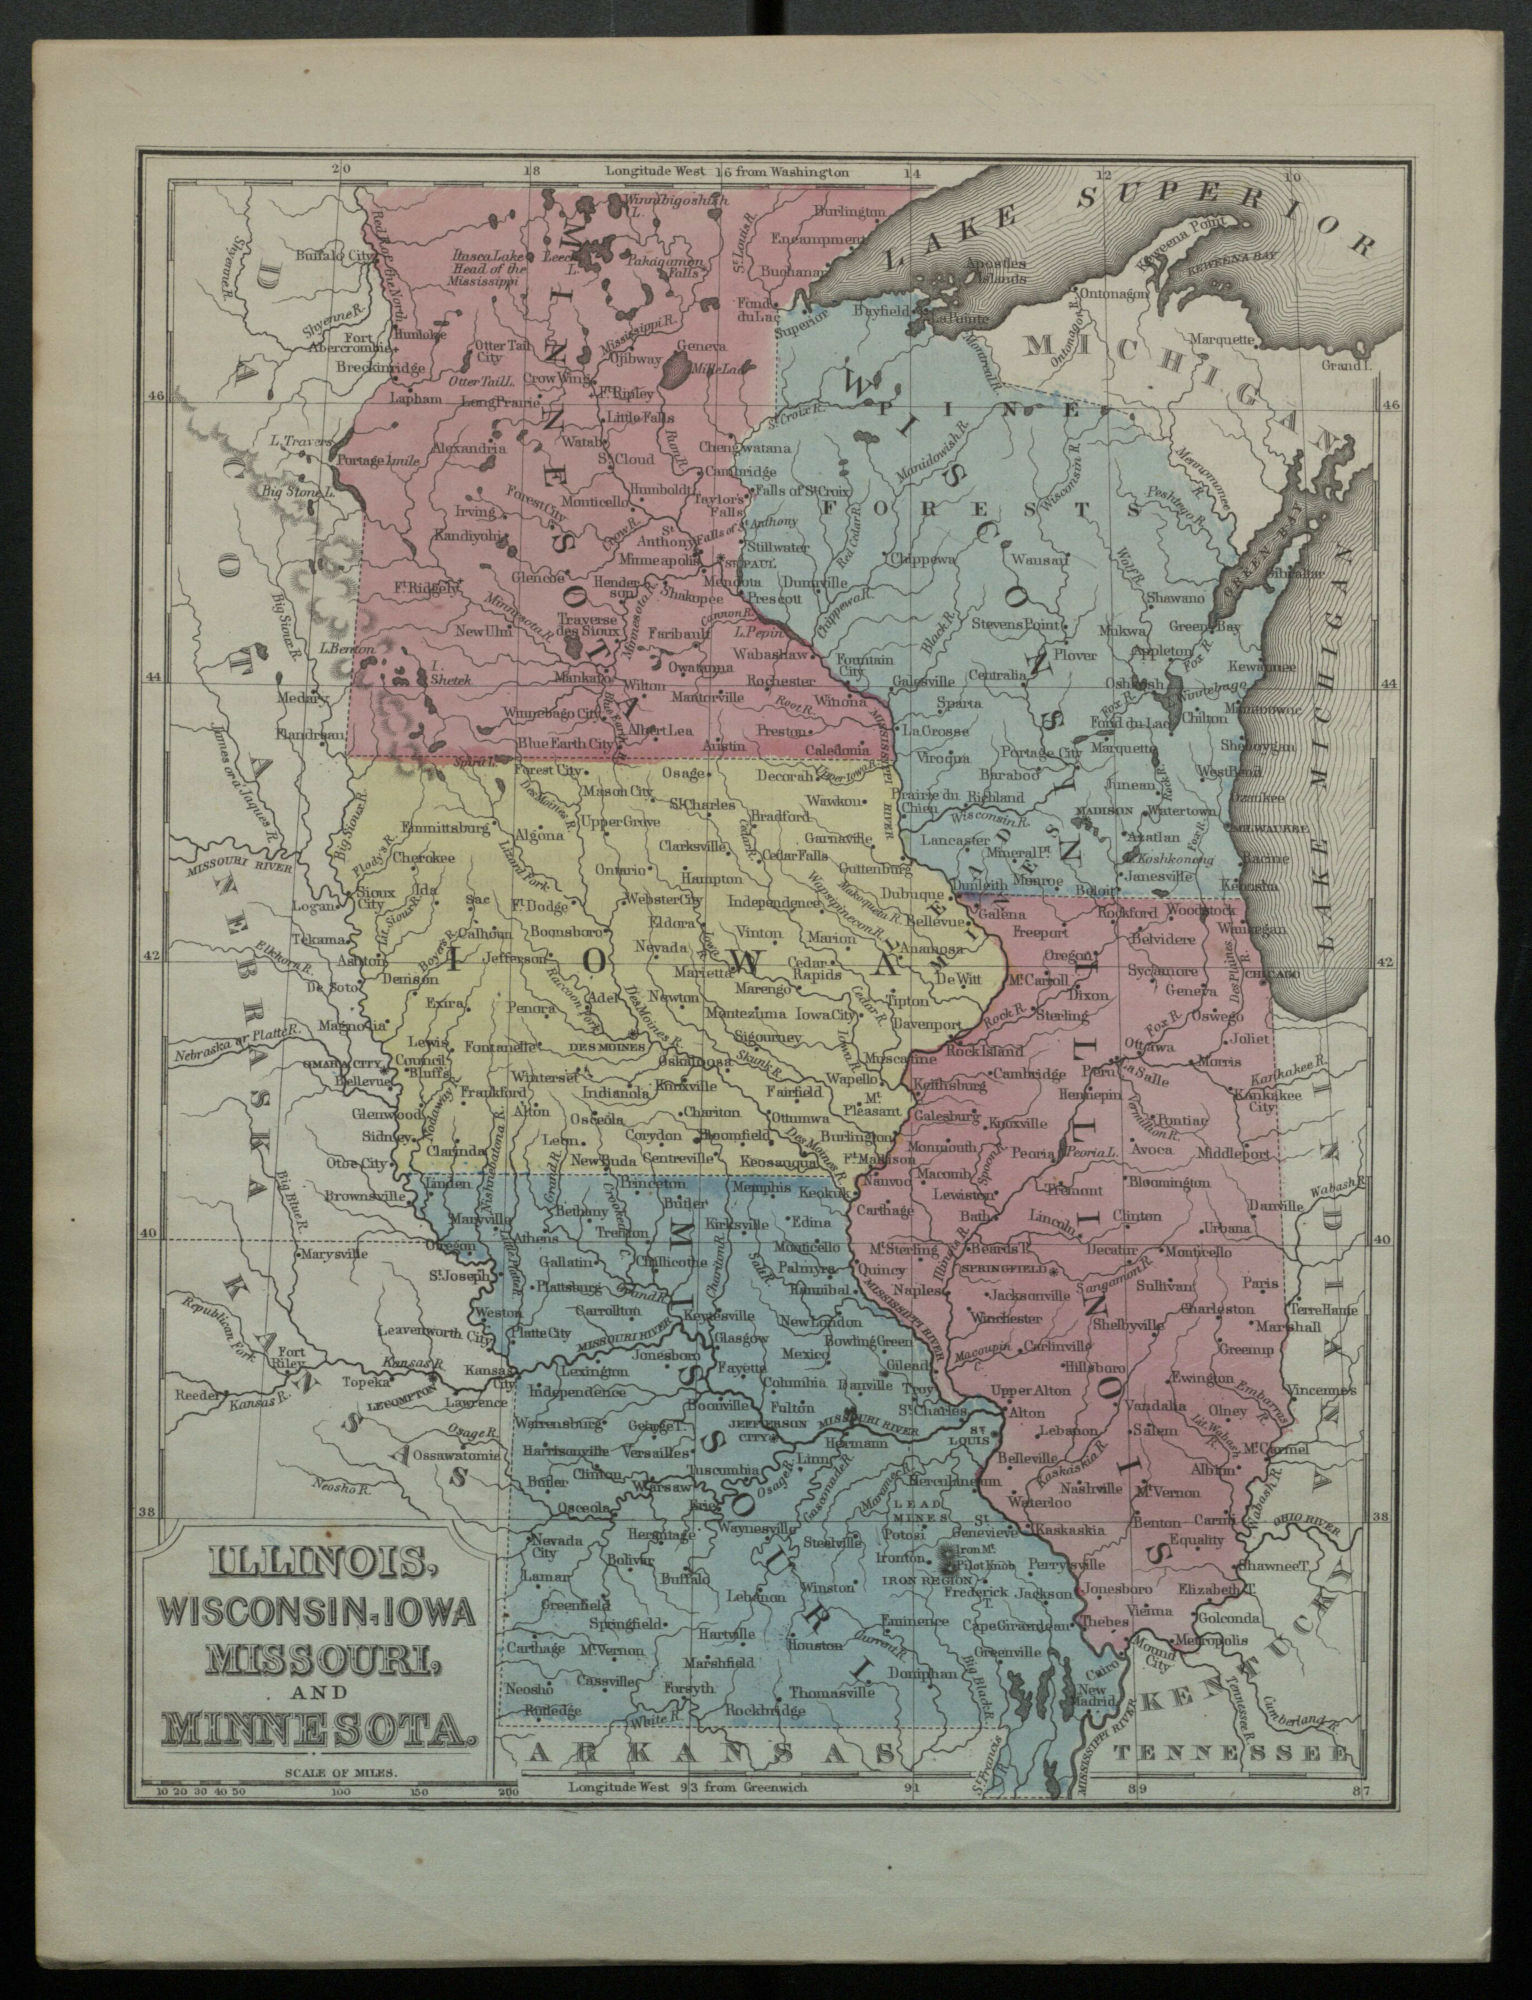
Illinois, Wisconsin, Iowa, Missouri, and Minnesota.
[Philadelphia, ca. 1866].
Samuel Augustus Mitchell (1792-1868)
Samuel Augustus Mitchell was at the forefront of the industrialization of the American mapmaking business. This map of midwestern states was part of the textbook Mitchell’s New Intermediate Geography. Dating the book is a little challenging since Mitchell didn’t update copyright notices when he reprinted it, but it was widely used in the 1860s and was even used as the basis of a Confederate student geography in 1862 since no comparable textbook was available in the South.
Like many of Mitchell’s maps (and maps done by his competitor Johnson), this one is probably a lithograph, either drawn directly on the stone or transferred to it using an impression from an engraved plate. The color was likely applied by hand rather than using a technological solution: color lithography was expensive and difficult to achieve, requiring multiple stones or plates to be prepared and carefully aligned. (In the case of a map like this one, which has three different colors, four stones would have been needed.) Instead, maps were commonly colored by professional map colorists, who were hired to fill in the color. Given the number of copies of this map that Mitchell’s company had to produce, quantity was more important than quality, as can be recognized in the overlap between different colors along the borders of different states. A particularly egregious example is at the northern end of Illinois, where the area around Galena appears almost purple from the amount of overlapping color.
The back of the map, not pictured here, features a short set of facts about Ohio and a series of questions about another map that includes Michigan, Ohio, Indiana, and Kentucky. To answer the questions a student would need to study the map very closely. The questions about Michigan, for instance, ask students to identify different lakes relative to their position to Michigan and the location of different prominent cities. The page describing Missouri notes that in 1880, the population of the state was 2,163,380 and that “there are institutions of learning at St. Louis, Cape Girardeau, Columbia, Springfield, and Liberty.”


Gallery of maps (click to enlarge).
N.B.: The descriptions of each map have been shortened to better fit in the captions in the gallery. For the full text, see above.
- Abraham Ortelius’s map of the Americas, Americae sive novi orbis, nova descriptio (A new description of the Americas, or the new world), 1587.
- Frederik De Wit’s map of the Americas, Nova Totius Americae Descriptio (A new complete depiction of the Americas), 1666.
- Richard William Seale’s map of South America, A Map of South America With all the European Settlements & whatever else is remarkable from the latest & best observations, 1780.
- Thomas Kitchin’s map of North America, A New Map of the British Empire in North America, ca. 1785.
- Alvin J. Johnson's map of the Midwest, Missouri and Kansas, ca. 1862.
- Samuel Augustus Mitchell’s map of the Midwest, Illinois, Wisconsin, Iowa, Missouri, and Minnesota, ca. 1866.